Survey: One Command for a Dashboard of Every context-v Folder
Graphify maps your code. Survey maps your context: what's in flight, what's stuck, what's a stub, and who's moving, at any scope.
- Path
- changelog/2026-10-28_01.md
- Authors
- Michael Staton
- Augmented with
- Claude Code on Claude Opus 5.5
- Tags
- Context-Vigilance · Dashboards · Pseudomonorepos · Spikes
Still moving. This entry records day one of the survey and will be revised as the three spikes merge into one page and
/cv:surveyships.
Why Care?
A
context-v/
folder is easy to write into and hard to see. One repo with thirty docs is fine. A tree of repos, each with its own
context-v/
, is not. Ours has 50 of them holding about a thousand docs, and until today nobody, human or agent, could answer
"what's in flight, what's stuck, what did we promise and never close"
without opening files one at a time.
Graphify answers
"what is this codebase"
with one command and a file you open.
Survey
answers
"what is the state of our context"
the same way: run it, get a dashboard, a task list, and a map of every
context-v/
in the scope you asked for. It also does two jobs we didn't have a tool for:
-
Cleanup. Find the stubs, the empty skeletons, the docs whose checkboxes are all ticked but whose status still says Draft, and the statuses that fit no lifecycle at all. Then delete, finish, or close them on purpose.
-
Thinking like a CTO. Which repos are actually moving? Which specs are signed off with nobody building them? Which issues are documented well enough to hand to someone today?
What's New?
-
A spec , written in the VP Product voice: Survey a Scoped Dashboard of Context V . Four scopes (one repo, a whole subtree, a repo and its ancestors, or a hand-picked set), three outputs (
survey.json, an agent-readableSURVEY.md, a single offline HTML page), and the house rule of three viewing modes: light, dark, and vibrant. -
A scanner (
scan.py): standard-library Python, read-only. The whole Lossless tree (105 repos) scans in about six seconds, including onegit logper repo for commit velocity. -
A report (
report.py):SURVEY.md, bounded to a few hundred lines even at full-tree scope, with sections for momentum, the option set, in-flight work, open issues, open checkboxes, and a cleanup worklist. -
Three render spikes , each a different answer to "what should the first screen be?": Ledger, Board, and Map.
-
A copy-path button on every doc , in every view. It copies the absolute path, so you can paste it straight to an agent: "work on this one."
-
A Survey page on this site , with live examples: a survey of our whole tree and of this kit alone, each in all three views.
-
The views of our tree live in the corpus , which is where tree-wide context belongs. The code stays here; the corpus's
refresh-survey.shruns it and files the results, and its splash serves them under Dashboard . -
A plan the survey made obvious: Retrofit Every Repo to OKF Then the Kit Frontmatter . 945 docs across 47 repos predate the rule that every doc declares its
type. The plan sweeps the repos whose three branch tiers are at parity, logs the rest for troubleshooting, and lands two commits and two changelog entries in each: one for OKF, one for the kit's metadata template.
The first screens
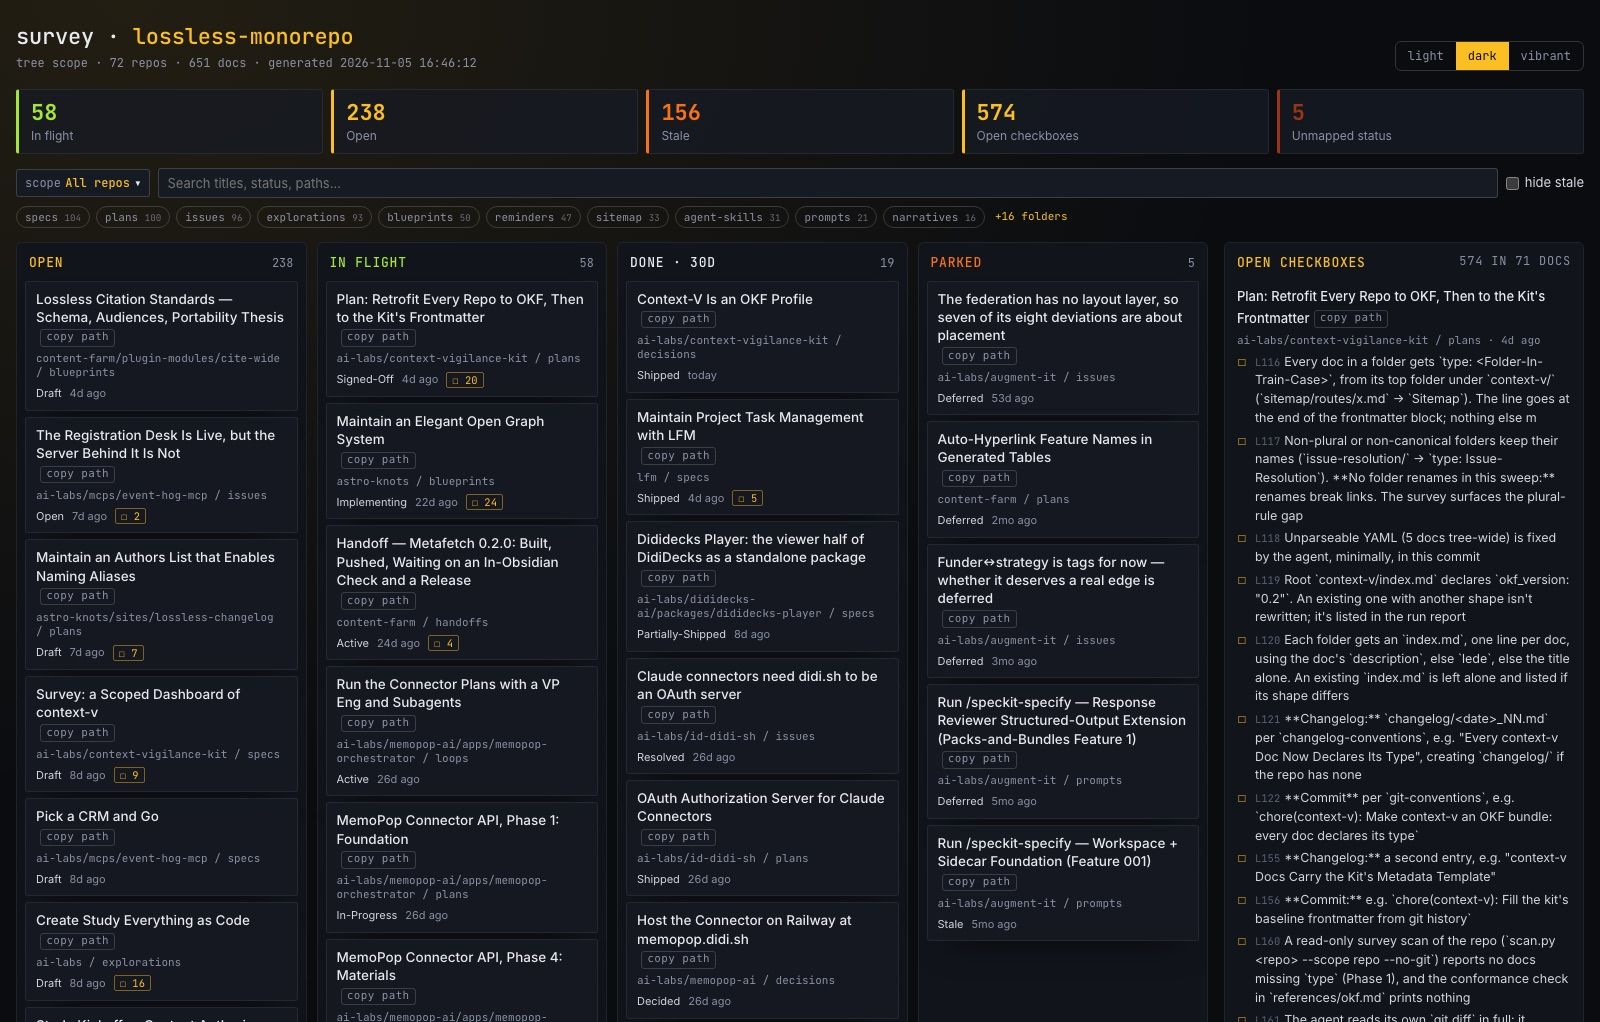
Board puts the work first: what's in flight, what's open, and a rail of every unchecked checkbox in a live plan or spec, with its line number.
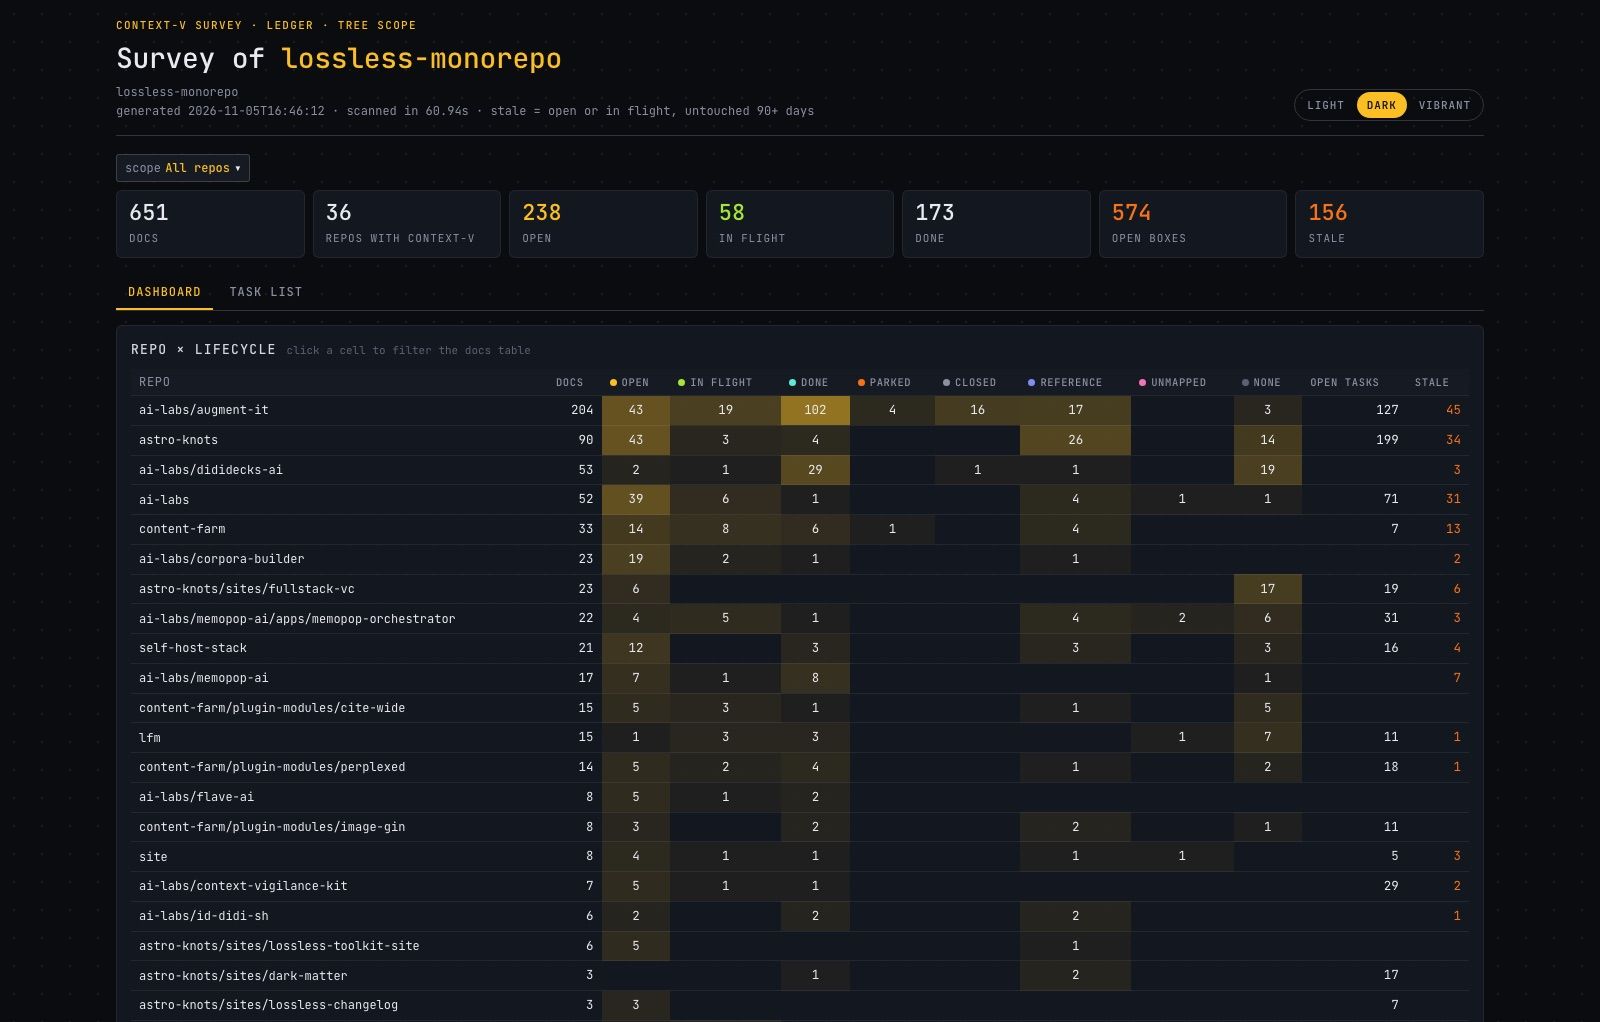
Ledger puts the portfolio first: a repo × lifecycle matrix, shaded by volume, where every cell clicks through to its docs.
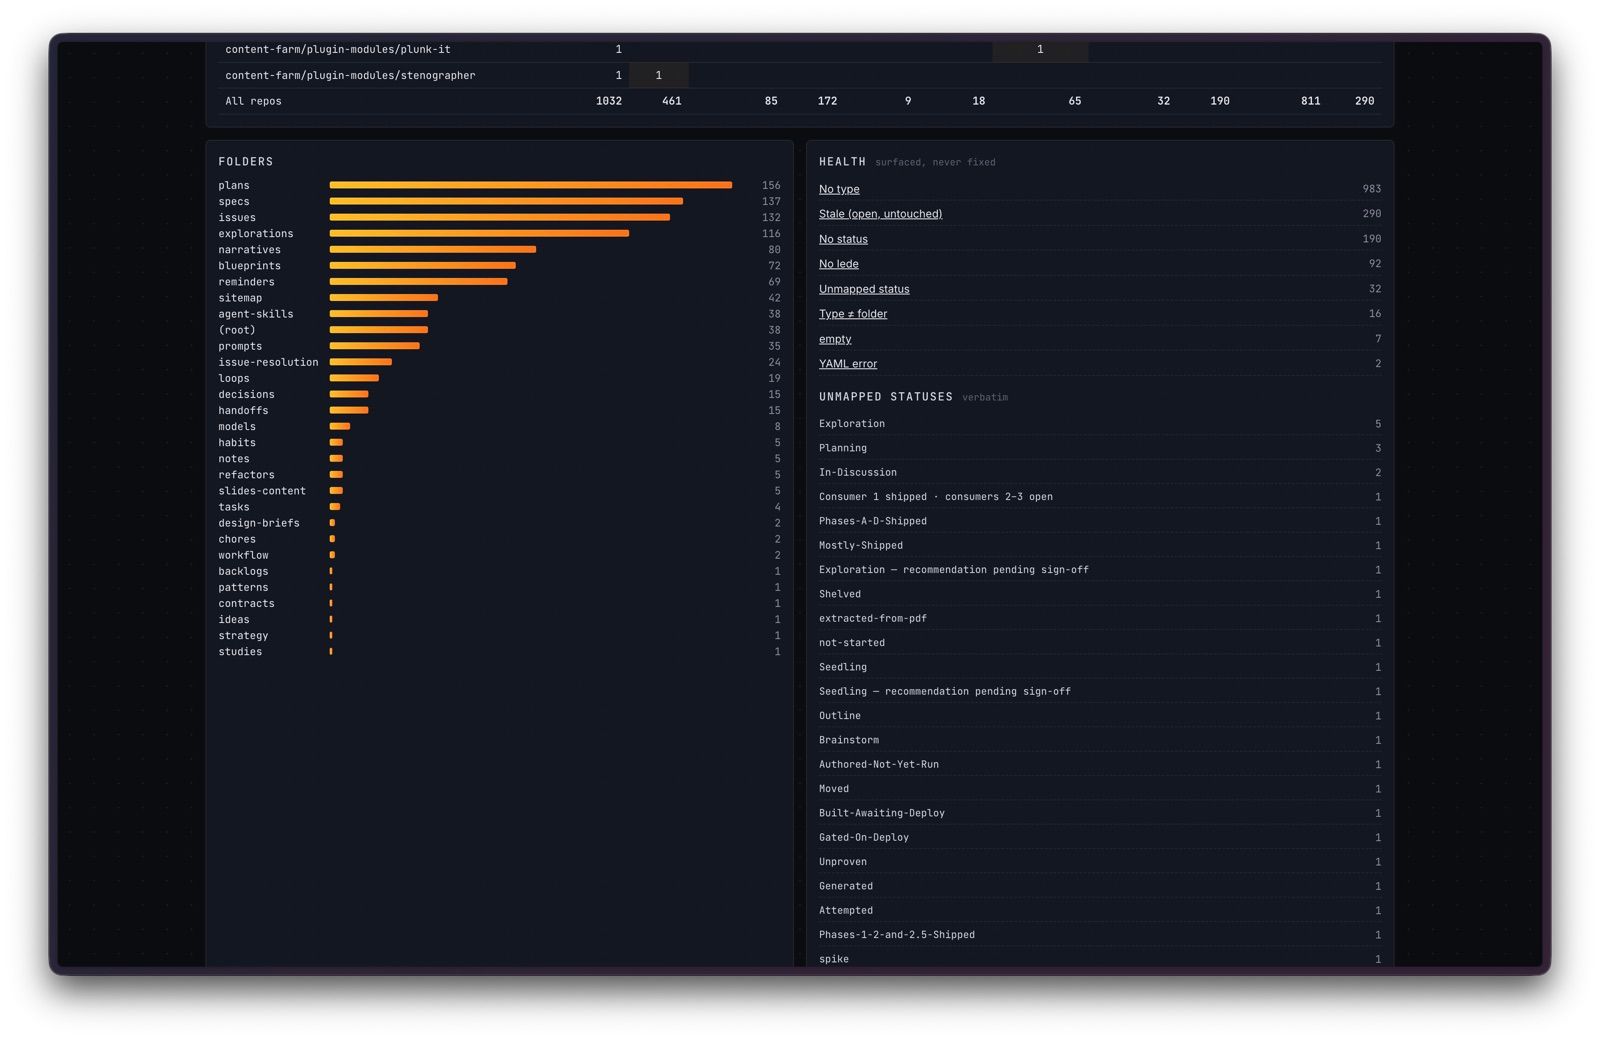
Further down the Ledger, the health panel is the cleanup view: folders by volume, docs missing metadata, and every status that fits no lifecycle, listed word for word.
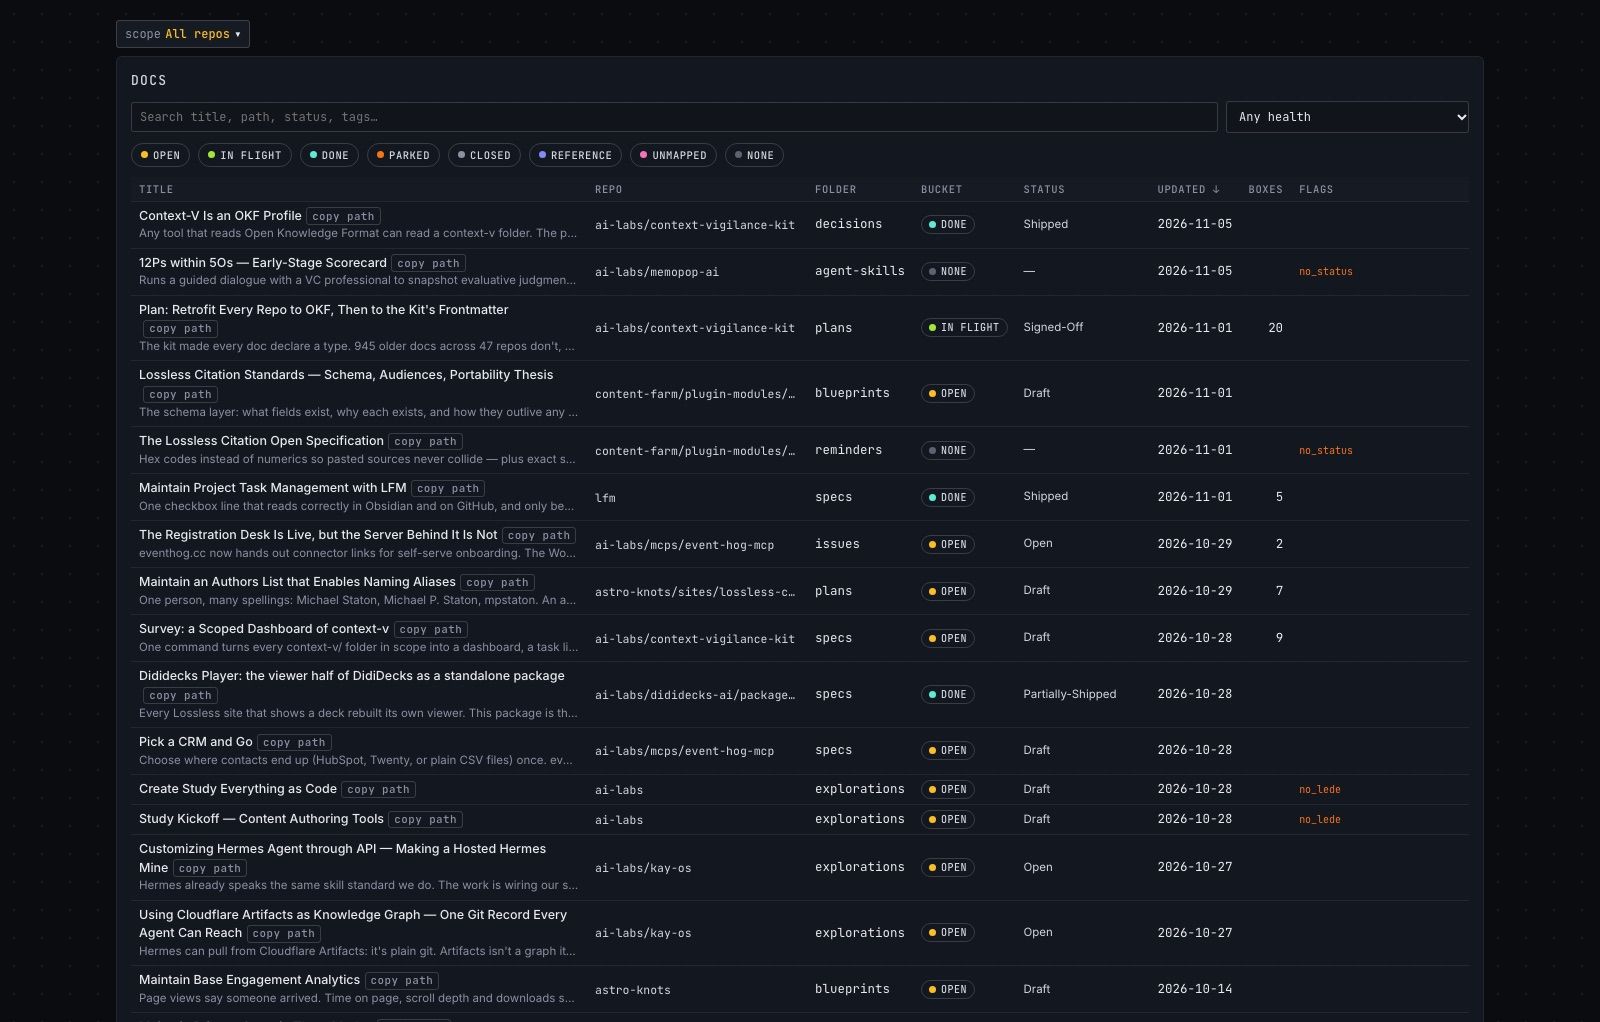
The Board, Ledger and doc-table screenshots were retaken on 2026-11-05 from public repos only, so their counts differ from the numbers above.
What we learned on day one
The first number was wrong by 60%.
The first whole-tree scan counted 1,651 docs. 619 of them were copies: a parent's splash rolls its children's docs up into
splash/src/rollup/context-v/
, and the scanner read those as originals. All three render spikes surfaced it independently, as "folders named after repos." The scanner now skips roll-ups, and
ai-labs
on its own went from 522 docs to its true 56.
Status in the wild is messy, and that's fine.
Docs say
Draft
,
shipped
,
Open · Jotted
,
Proven-Once
,
Resolved-Pending-Confirmation
, and long sentences. The survey keeps every raw value and adds a lifecycle bucket (open, in flight, done, parked, closed, reference). After two passes at the mapping, 32 of 1,032 still fit nowhere, and those are listed verbatim as drift rather than guessed at.
"Who's moving" needs care. Counting commits per repo first credited upstream authors of forks and pinned study repos, and dropped a client-owned repo we work in daily. The rule now: a repo counts as ours when the operator committed there in the last 30 days. Today that view says one person and one agent did 633 commits across the tree this month, with nearly every one agent-assisted. That's honest about where we are, and the per-person view is built for when collaborators join.
Each spike won something different. Board is the best "what do I work on?" view. Ledger is the best "where is work piling up?" view. Map is the best way to find one doc among 105 repos. The plan is one page with three tabs, opening on Board for a single repo and on Ledger for a tree.
Under the Hood
-
Scope comes from the nearest git repo at or above where you run it. A repo is any directory with a
.gitentry, so submodules count. Upstream study repos,node_modules, everycontext-v/extra/, and roll-up copies are skipped. -
Cleanup signals:
empty(under 40 words of prose, outside code and headings),stub/idea-started/worked-onby content lines (the same cut the corpus manifest uses),maybe_done(every checkbox ticked, status still open), plus missing or mismatched frontmatter. -
Option set: signed-off or ready specs and plans nobody is building, specs waiting on a decision, open issues, and in-flight work that has gone quiet. Each is ranked by readiness: acceptance criteria, how developed it is, recent change, and whether its repo is moving.
-
Private by default. A survey writes to
context-v/extra/survey/, which the practice already gitignores. Publishing one is a choice:--publicdrops private docs and absolute paths for a page strangers will see.
What's Next
-
Settle the spike questions in the spec (one definition per metric, one bucket palette), then merge the three into a single page with Board, Ledger, and Map tabs plus a CTO tab.
-
Write
SKILL.mdso/cv:surveyships in the plugin. -
Run the OKF retrofit: build the retrofit tool into
/cv:upgrade, gate the tree for branch parity, pilot two repos, then sweep the rest.